Quantcast
Channel: r software hub
Viewing all articles
Browse latest Browse all 1015

World Map Panel Plots with ggplot2 2.0 & ggalt

$
0
0

By hrbrmstr

facetmaps

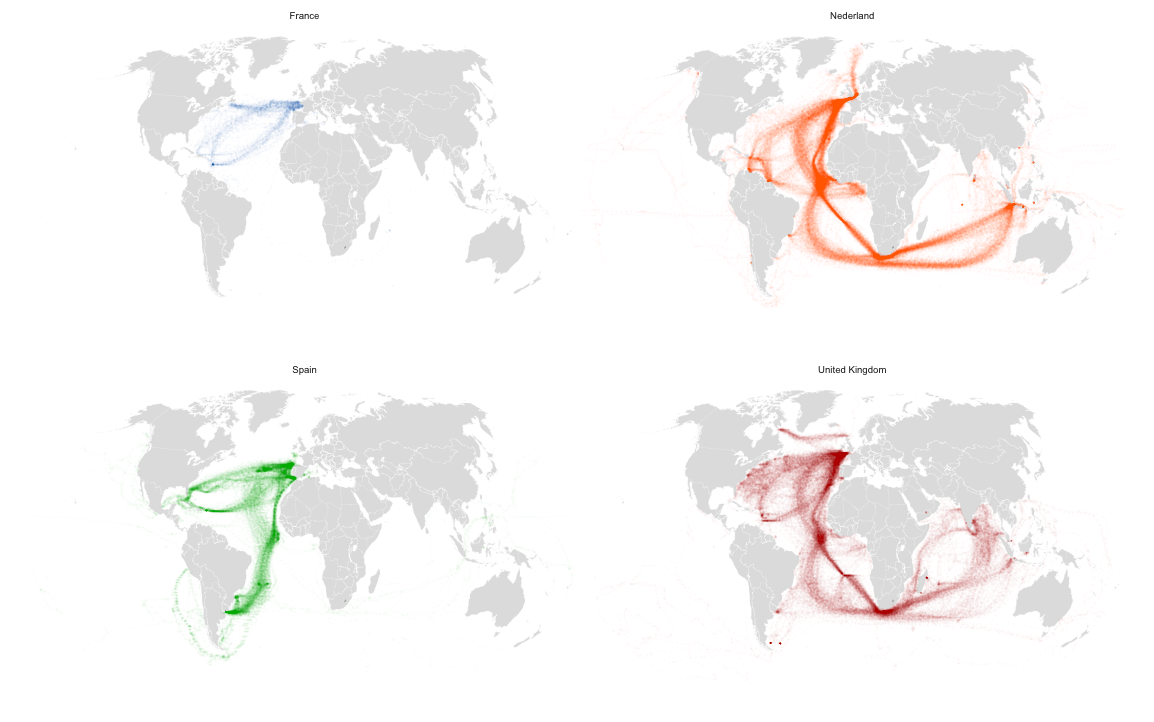
James Austin (@awhstin) made some #spiffy 4-panel maps with base R graphics but also posited he didn’t use ggplot2 because:

ggplot2 and maps currently do not support world maps at this point, which does not give us a great overall view.

That is certainly a box I would not put ggplot2 into, especially with the newly updated R maps (et al) packages, ggplot2 2.0 and my (still in development) ggalt package (though this was all possible before ggplot2 2.0 and ggalt). NOTE: I have no idea why I get so defensive about ggplot2 besides the fact that it’s one the best visualization tools ever created.

Here’s all you need to use the built-in facet options of ggplot2 to make the 4-panel plot (as James points out, you can get the data file from here: (CLIWOC15.csv)[http://www.austinwehrwein.com/wp-content/uploads/2015/12/CLIWOC15.csv]):

library(ggplot2)  # FYI you need v2.0
library(dplyr) # yes, i could have not done this and just used 'subset' instead of 'filter'
library(ggalt) # devtools::install_github("hrbrmstr/ggalt")
library(ggthemes) # theme_map and tableau colors

world map_data("world")
world world[world$region != "Antarctica",] # intercourse antarctica

dat read.csv("CLIWOC15.csv") # having factors here by default isn't a bad thing
dat filter(dat, Nation != "Sweden") # I kinda feel bad for Sweden but 4 panels look better than 5 and it doesn't have much data

gg ggplot()
gg gg + geom_map(data=world, map=world,
aes(x=long, y=lat, map_id=region),
color="white", fill="#7f7f7f", size=0.05, alpha=1/4)
gg gg + geom_point(data=dat,
...read more

Source:: r-bloggers.com


Viewing all articles
Browse latest Browse all 1015

Trending Articles