By tylerrinker
Several years back I wrote a two part blog series in response to seeing questions about plotting and reordering on list serves, talkstats.com, and stackoverflow. Part I discussed the basics of reordering plots by reordering factor levels. The essential gist was:
So if you catch yourself using “re-arrange”/”re-order” and “plot” in a question think…factor & levels
Part II undertook re-ordering as a means of more easily seeing patterns in layouts such as bar plots & dot plots.
Well there is at least one time in which reordering factor levels doesn’t help to reorder a plot. This post will describe this ggplot2 based problem and outline the way to overcome the problem. You can get just the code here.
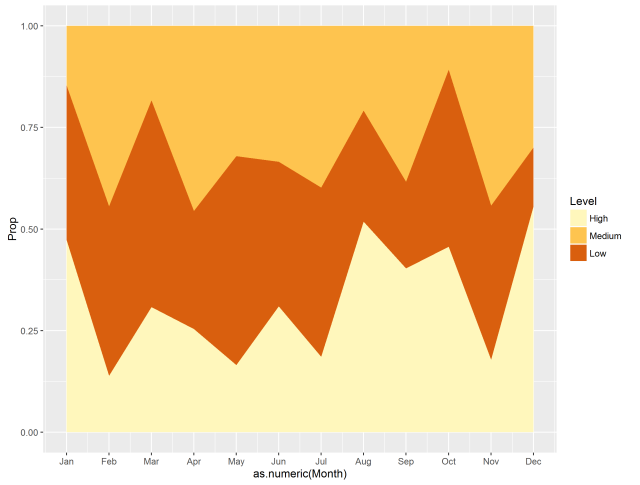
In a stacked ggplot2 plot the fill ordering is not controlled by factor levels. Such plots include a stacked bar and area plot. Here is a demonstration of the problem.
Load Packages
if (!require("pacman")) install.packages("pacman")
pacman::p_load(dplyr, ggplot2)
Generate Data
Here I generate a data set containing a time series element (Month), counts (Count), and a leveling variable (Level). The counts are transformed to proportions and the Level variable is converted to a leveled factor with the order “High”, “Medium”, “Low”. This leveling is key to the problem as it will be used as the fill variable. It is here that reordering the factor levels will not work to reorder the plot.
dat %
    mutate(
        Level = factor(Level, levels = c("High", "Medium", "Low")),
        Month = factor(Month, levels = month.abb)
    ) %>%
    group_by(Month) %>%
    mutate(Prop = Count/sum(Count))
Plot a Stacked Area Plot
Next we generate the area plot. The accompanying plot demonstrates the problem. Notice …read more
Source:: trinkerrstuff.wordpress.com