In a previous post, I wrote about what I use association rules for and mentioned a Shiny application I developed to explore and visualize rules. This post is about that app. The app is mainly a wrapper around the arules and arulesViz packages developed by Michael Hahsler.
Features
- train association rules
- interactively adjust confidence and support parameters
- sort rules
- sample just top rules to prevent crashes
- post process rules by subsetting LHS or RHS to just variables/items of interest
- suite of interest measures
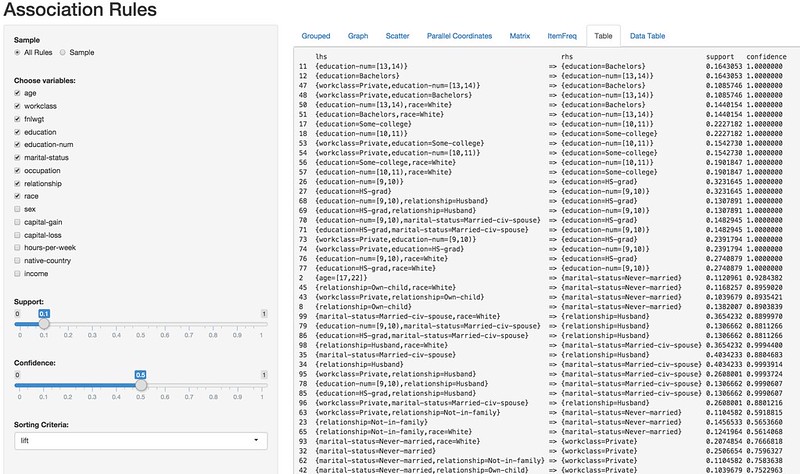
- visualize association rules
- grouped plot, matrix plot, graph, scatterplot, parallel coordinates, item frequency
- export association rules to CSV
How to get
Option 1: Copy the code below from the arules_app.R gist
Option2: Source gist directly.
library('devtools')
library('shiny')
library('arules')
library('arulesViz')
source_gist(id='706a28f832a33e90283b')
Option 3: Download the Rsenal package (my personal R package with a hodgepodge of data science tools) and use the arulesApp function:
library('devtools')
install_github('brooksandrew/Rsenal')
library('Rsenal')
?Rsenal::arulesApp
How to use
arulesApp is intended to be called from the R console for interactive and exploratory use. It calls shinyApp which spins up a Shiny app without the overhead of having to worry about placing server.R and ui.R. Calling a Shiny app with a function also has the benefit of smooth passing of parameters and data objects as arguments. More on shinyApp here.
arulesApp is currently highly exploratory (and highly unoptimized). Therefore it works best for quickly iterating on rule training and visualization with low-medium sized datasets. Check out Michael Hahsler’s arulesViz paper for a thorough description of how to interpret the visualizations. There is a particularly useful table on page 24 which compares and summarizes the visualization techniques.
Simply call arulesApp from the console with a data.frame or transaction set for which rules will be mined from:
library('arules') contains Adult and AdultUCI datasets

data('Adult') # transaction set
arulesApp(Adult, vars=40)

data('AdultUCI') # data.frame
arulesApp(AdultUCI)
Here are the arguments:
datasetdata.frame, this is the dataset that association rules will be mined …read moreSource:: r-bloggers.com