By hrbrmstr
I follow the most excellent Pew Research folks on Twitter to stay in tune with what’s happening (statistically speaking) with the world. Today, they tweeted this excerpt from their 2015 Global Attitudes survey:
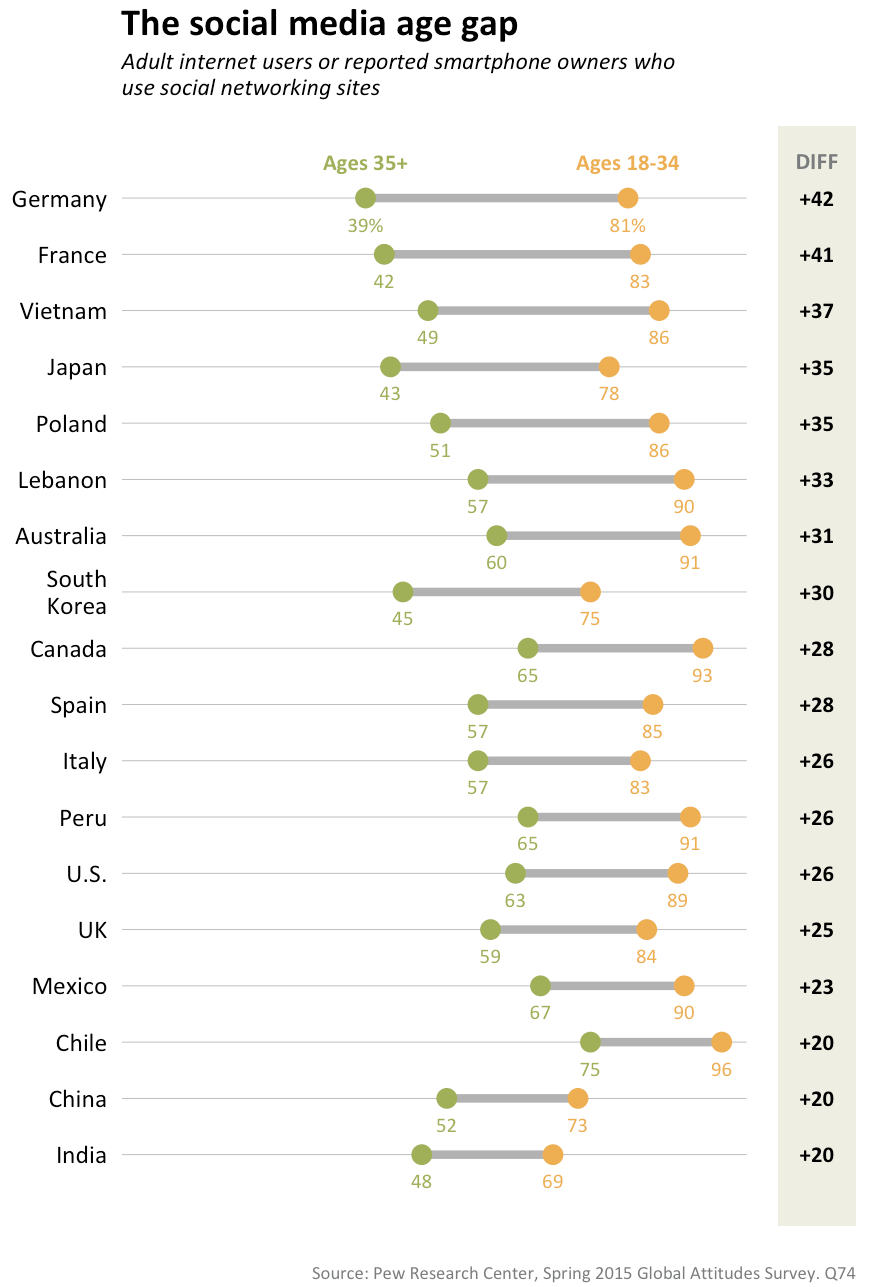
The age gap in social media use around the world https://t.co/0Dq1PcbExG pic.twitter.com/9HBM7gLxwR
— PewResearch Internet (@pewinternet) April 17, 2016
I thought it might be helpful to folks if I made a highly aesthetically tuned version of Pew’s chart (though I chose to go a bit more minimal in terms of styling than they did) with the new geom_dumbbell() in the development version of ggalt. The source (below) is annotated, but please drop a note in the comments if any of the code would benefit from more exposition.
I’ve also switched to using the Prism javascript library starting with this post after seeing how well it works in RStudio’s flexdashboard package. If the “light on black” is hard to read or distracting, drop a note here and I’ll switch the theme if enough folks are having issues.
library(ggplot2) # devtools::install_github("hadley/ggplot2")
library(ggalt)   # devtools::install_github("hrbrmstr/ggalt")
library(dplyr)   # for data_frame() & arrange()

# I'm not crazy enough to input all the data; this will have to do for the example
df
Related
R-bloggers.com offers daily e-mail updates about R news and tutorials on topics such as: Data science, Big Data, R jobs, visualization (ggplot2, Boxplots, maps, animation), programming (RStudio, Sweave, LaTeX, SQL, Eclipse, git, hadoop, Web Scraping) statistics (regression, PCA, time series, trading) and more…
Source:: r-bloggers.com