By BioStatMatt
(This article was originally published at statistics – BioStatMatt, and syndicated at StatsBlogs.)
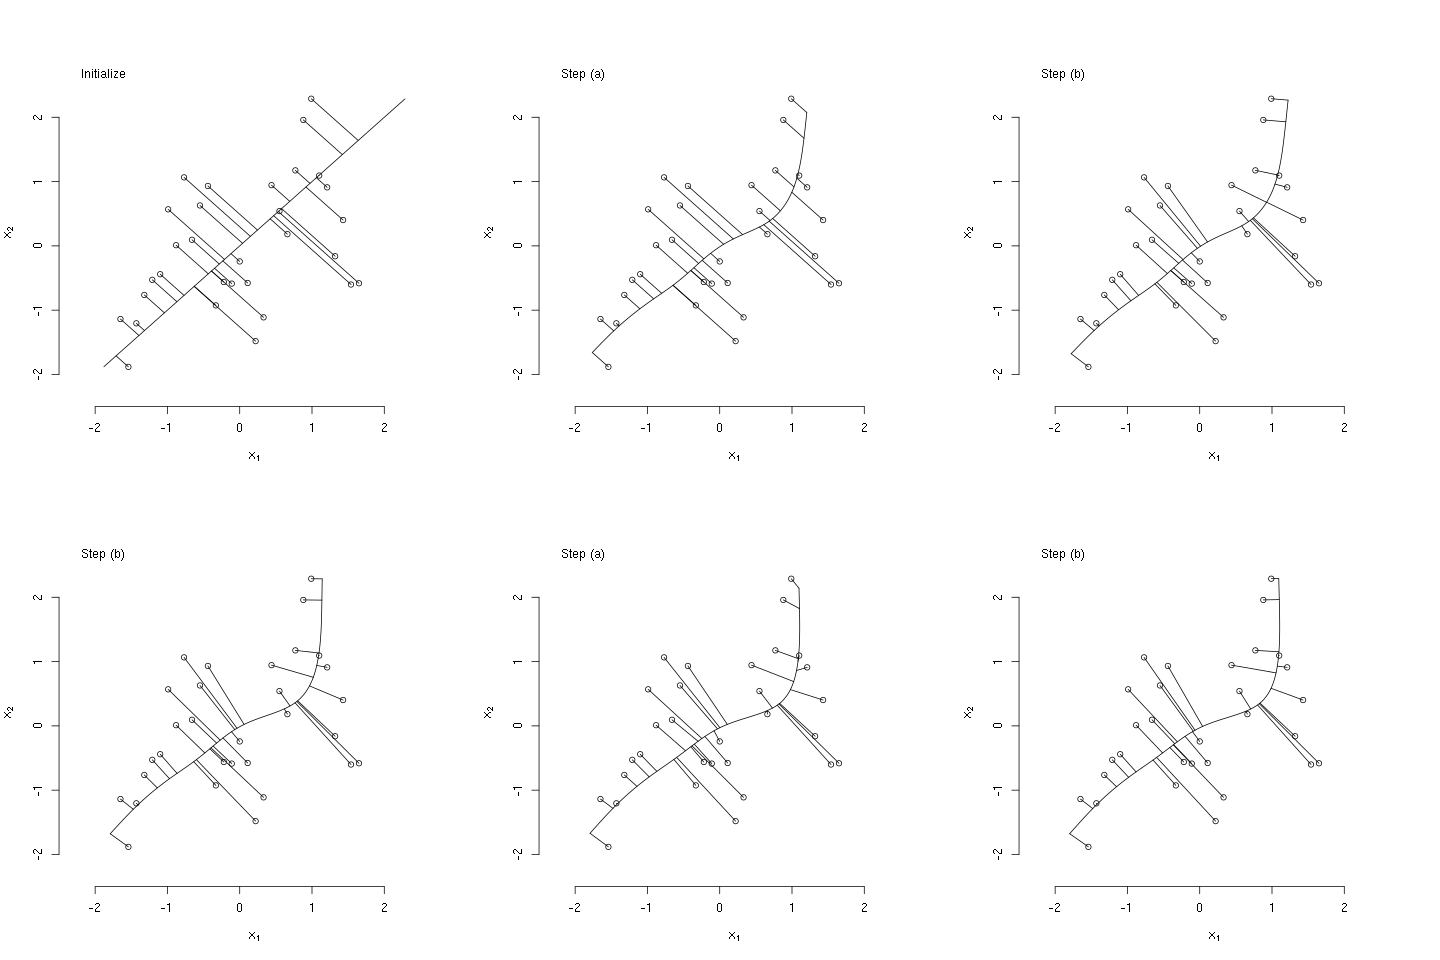
The bit of R code below illustrates the principal curves methods as described in The Elements of Statistical Learning, by Hastie, Tibshirani, and Friedman (Ch. 14; the book is freely available from the authors’ website). Specifically, the code generates some bivariate data that have a nonlinear association, initializes the principal curve using the first (linear) principal component, and then computes three iterations of the algorithm described in section 14.5.2. I used the ‘animation’ package to generate the following animated GIF, which illustrates these steps.
## generate some bivariate data
set.seed(42)
x1
Please comment on the article here: statistics – BioStatMatt
Tags: ESL, graphics, Programming, R, statistics, Technical
Source:: statsblogs.com
